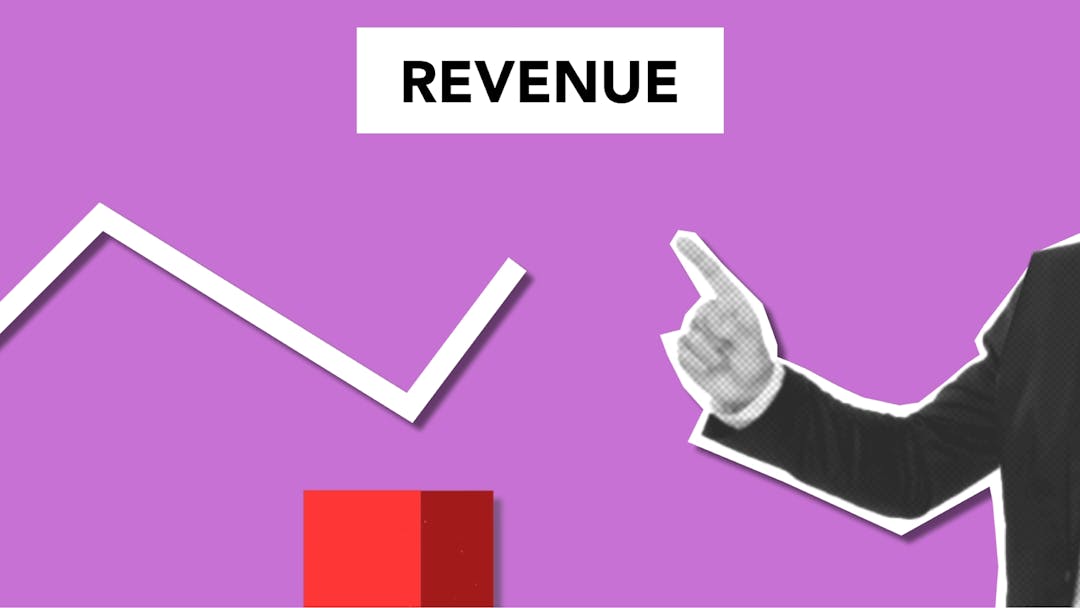
Why CAC Trends Matter More Than Snapshots - What Buyers Really See in Your Customer Acquisition Economics
CAC trends reveal business health better than point-in-time metrics. Learn how buyers analyze customer acquisition trajectory to assess sustainability.
Consider a scenario that plays out more often than sellers expect: a buyer walks away from a seemingly attractive deal after discovering what impressive CAC numbers were hiding. A company’s customer acquisition cost of $847 might look solid against a $4,200 lifetime value—a healthy 5:1 ratio that should advance negotiations. But when a buyer’s analysts chart CAC movement over 36 months, they might find costs climbing at a rate that significantly outpaces revenue growth while LTV remains flat. That trajectory tells a story of eroding competitive advantage that no single-quarter snapshot could reveal.
Executive Summary
Customer acquisition cost trends function as a vital sign monitor for business health, revealing patterns that many sophisticated buyers weight heavily in their valuation models. While point-in-time CAC calculations provide a useful benchmark, trend analysis exposes the underlying dynamics of market position, competitive intensity, and operational efficiency that influence long-term sustainability.
Many buyers examining acquisition targets prioritize trajectory over snapshots. Based on our experience advising exit-focused business owners and reviewing deal processes, private equity firms and strategic acquirers commonly request 24-36 months of customer acquisition trend data before advancing past initial screening, though specific requirements vary by buyer type, industry, and deal size. A rising CAC in a stable market often signals competitive pressure and potential margin compression. A declining CAC alongside growing revenue may suggest operational excellence and scalable customer acquisition engines. The relationship between CAC movement and customer lifetime value evolution provides even deeper insight: when these metrics move in concert versus divergence, buyers draw very different conclusions about business durability.
This analysis provides frameworks for understanding how buyers may interpret CAC trends, what specific patterns can signal about competitive position and market dynamics, and how presenting customer acquisition economics in trend format rather than isolated metrics can position your business for stronger valuations. For owners of recurring revenue businesses planning exits in the two-to-seven year window, understanding and optimizing these trends represents a high-leverage activity, though its relevance varies based on your business model, size, and target buyer profile. The customer acquisition trend data you’re generating today will likely influence buyer confidence and deal terms tomorrow.
Introduction
Based on extensive experience reviewing confidential information memorandums across B2B services, manufacturing, technology, and distribution businesses in the $2M-$30M revenue range, a consistent pattern emerges: sellers present their best numbers while buyers hunt for the story behind those numbers. Nowhere is this dynamic more pronounced than in customer acquisition economics.
The standard approach treats customer acquisition cost as a point-in-time calculation: divide marketing and sales expenses by new customers acquired, arrive at a number, compare it to industry benchmarks. This approach satisfies basic due diligence checkboxes but often fails to address the questions that actually drive buyer decisions: Is this acquisition cost sustainable? Will it scale? What happens when we inject growth capital?

Many sophisticated buyers, particularly private equity groups and strategic acquirers with operational experience in your sector, have learned that CAC trajectory can provide valuable context about future performance dynamics that CAC snapshots alone may not reveal. These buyers have seen acquisitions where attractive snapshot metrics masked deteriorating fundamentals, leading to painful post-close discoveries. They’ve also seen deals where higher-than-benchmark CAC numbers accompanied by improving trends signaled turnaround potential that justified premium multiples.
Important Scope Note: This analysis applies primarily to businesses with recurring revenue models or repeat purchase patterns where customer lifetime value can be meaningfully calculated. Transaction-based businesses, project-focused companies, or those with highly variable customer relationships may face different evaluation criteria. Businesses below roughly $5M in annual revenue may find that buyers prioritize simpler metrics like customer concentration and revenue stability over sophisticated CAC trend analysis.
The implications for exit-focused owners are significant. The customer acquisition cost trends you’re experiencing right now, whether you’re actively monitoring them or not, are creating a data trail that will either support or undermine your eventual exit narrative. Understanding how buyers might interpret these trends allows you to take corrective action while you still have runway, present your metrics in their most favorable and accurate context, and anticipate the questions that will shape buyer perception.
Customer acquisition trends tell a story about your business. The question is whether you’re aware of the story being told and whether you’re positioned to shape the narrative before buyers draw their own conclusions.

How Buyers Analyze CAC Trajectory as a Market Health Indicator
When private equity analysts or corporate development teams begin evaluating an acquisition target, they’re often not simply looking at whether your business can acquire customers profitably today. They’re assessing whether that profitability will persist, improve, or deteriorate under their ownership. For many buyers, particularly those focused on recurring revenue businesses, CAC trajectory serves as one important lens for this assessment, though it’s rarely the only factor they consider.
The analysis typically begins with a minimum of 24 months of monthly or quarterly CAC data, though 36-48 months provides the context many buyers prefer. They’re calculating not just the absolute trend direction but the rate of change, the volatility around that trend, and the correlation with external factors they can verify independently.
The Sustainability Question

Rising CAC trends typically trigger concern about sustainability, though context matters significantly. Buyers understand that customer acquisition costs increase for predictable reasons: market saturation reducing the available prospect pool, competitive entry increasing advertising costs, channel maturation forcing expansion into less efficient acquisition methods, or product-market fit erosion requiring more persuasion to close deals.
Not all CAC increases signal trouble. Rising acquisition costs can also reflect strategic investments: expansion into new markets, premium customer segment targeting, or brand-building activities that increase short-term costs while building long-term value. Sophisticated buyers distinguish between CAC increases driven by market deterioration versus those reflecting intentional growth investments with defensible rationale.
Each cause carries different implications for post-acquisition performance. Market saturation in a large addressable market differs fundamentally from saturation in a niche vertical. Competitive entry by well-funded players suggests ongoing margin pressure, while entry by undercapitalized competitors may represent temporary noise.
Buyers often analyze your CAC trends against market data they gather independently: advertising cost benchmarks, competitive intelligence on new entrants, industry reports on market growth rates. When your trends align with market-level shifts, they may view the situation as manageable. When your CAC rises faster than market factors explain, they typically probe for company-specific problems.

The Efficiency Signal
Declining or stable CAC trends in growing markets can send powerful positive signals. Buyers often interpret these patterns as evidence of operational excellence: marketing teams that have optimized targeting, sales processes that have shortened cycles, product improvements that have increased conversion rates.
These trends suggest scalability. Buyers acquiring businesses often plan to inject capital for accelerated growth. A demonstrated ability to maintain or improve acquisition economics while growing provides confidence that their investment will generate returns rather than simply subsidize increasingly expensive customer acquisition.
The LTV Relationship

Sophisticated buyers rarely analyze CAC trends in isolation. The relationship between customer acquisition cost trajectory and customer lifetime value trajectory reveals whether improving CAC reflects genuine efficiency gains or problematic shortcuts.
We’ve observed businesses reduce CAC significantly through tactics that simultaneously reduced customer quality: shorter sales cycles that skipped qualification steps, promotional pricing that attracted deal-seekers rather than committed customers, reduced onboarding that left customers struggling to achieve value. In each case, CAC improvements masked LTV deterioration that manifested over 12-24 months.
Buyers examine the LTV/CAC trend ratio specifically. A stable or improving ratio indicates healthy unit economics regardless of whether individual metrics are rising or falling. A deteriorating ratio, particularly when CAC is declining but LTV is declining faster, signals problems that point-in-time analysis would completely miss.
A Note on Calculation Methodology

For clarity, the CAC and LTV figures buyers analyze follow standard calculation approaches, though methodologies vary. CAC typically includes all sales and marketing expenses (personnel, advertising, tools, content creation) divided by new customers acquired during the same period. LTV calculations commonly use either historical cohort analysis (actual revenue from customer groups over time) or predictive models (average revenue per customer multiplied by average customer lifespan, minus direct service costs). When presenting your metrics, explicitly documenting your calculation methodology prevents confusion and builds credibility. Any changes in methodology should be noted with restated historical figures for comparison.
Alternative Evaluation Frameworks
CAC trends represent one of several approaches buyers use to assess customer acquisition health. Other frameworks that buyers may prioritize include:
Customer Concentration Analysis: For high-value B2B businesses with key account focus, buyers may care more about dependency on top customers than aggregate CAC trends. A business deriving 40% of revenue from three clients faces concentration risk that no CAC metric captures.

Sales Efficiency Metrics: In long sales cycle businesses, leading indicators like pipeline quality, conversion rates by stage, and sales cycle length may matter more than trailing CAC numbers. These metrics predict future performance more directly.
Customer Cohort Performance: Some buyers focus on how specific customer groups acquired in particular periods perform over time, rather than aggregate trend analysis. This approach reveals whether recent customers are fundamentally different from historical ones.
The relative importance of CAC trend analysis versus these alternatives depends on your business model, industry, and the specific buyer’s evaluation framework.
What CAC Trend Patterns Can Signal About Competitive Position
Beyond basic trajectory analysis, specific CAC trend patterns carry interpretive weight that may influence buyer perception and valuation. Understanding these patterns allows owners to contextualize their own trends and prepare appropriate narratives. Note that pattern interpretation requires industry context: what signals concern in one sector may be normal in another.
The Hockey Stick Inversion
Revenue hockey sticks are celebrated; CAC hockey sticks often raise concerns. When customer acquisition costs show sudden inflection points, shifting from stable or declining trends to sharply increasing trajectories, buyers typically investigate the timing intensively.
Common triggers include market entry by well-capitalized competitors, the exhaustion of early-adopter segments, platform algorithm changes affecting digital acquisition channels, and the loss of key sales personnel. Each trigger carries different remediation prospects.
Sellers aware of recent CAC inflections should prepare detailed explanations and, where possible, evidence of corrective actions. Buyers tend to discount unexplained inflections heavily, often assuming the worst when information is incomplete.
Seasonal Volatility Versus Structural Movement
Many businesses experience seasonal CAC variation: B2B companies see efficiency dips during summer months and December, consumer businesses face holiday acquisition cost spikes, and businesses selling to specific industries reflect their customers’ budget cycles.
Buyers distinguish between seasonal volatility (normal and manageable) and structural movement (fundamental shifts in acquisition economics). The analysis examines whether high and low points are both increasing, decreasing, or stable over multiple cycles.
A business whose peak-season CAC rises annually while off-season CAC remains stable faces different dynamics than one where all periods show parallel movement. The former suggests capacity constraints during high-demand windows; the latter suggests market-level shifts affecting all periods equally.
Channel Migration Patterns
Many businesses show aggregate CAC stability that masks significant channel-level variation. Buyers often request channel-specific acquisition cost data to understand the underlying dynamics.
A stable aggregate CAC composed of declining costs in mature channels and rising costs in new channels tells a growth story: the business is successfully expanding its acquisition footprint. The same aggregate number composed of rising costs in primary channels offset by unsustainable promotional activity tells a deterioration story.
Forward-thinking sellers segment their CAC data by channel before buyers request it, identifying the narrative implications and preparing context for potentially concerning channel-level trends.
The Competitive Response Signature
CAC trends sometimes reveal competitive dynamics through distinctive signatures. A pattern of stable acquisition costs punctuated by sharp spikes followed by gradual recovery often indicates competitive response cycles: new entrants or existing competitors launching aggressive campaigns, initial market disruption, and eventual equilibrium at new levels.
Buyers experienced in your sector may recognize these signatures and interpret them in context. Multiple cycles demonstrating your ability to weather competitive attacks and return to efficient acquisition economics can provide confidence. A single cycle still in the recovery phase creates uncertainty about whether equilibrium will be restored.
The Power of Trend Presentation for Sophisticated Buyers
How you present customer acquisition economics in your sale process can significantly influence buyer perception. Moving from snapshot metrics to trend-based presentation demonstrates analytical sophistication, provides the context buyers require, and positions you to present your data clearly rather than react to buyer conclusions.
The Trend Analysis Framework
Effective trend presentation includes five components that address buyer concerns systematically:
Longitudinal Data Foundation: Minimum 24 months, preferably 36-48 months, of consistent CAC calculations using the same methodology throughout. Any methodology changes should be disclosed with restated historical figures. Document your calculation approach explicitly: whether you’re using fully-loaded costs (including overhead allocation) or direct costs only, and how you attribute multi-touch customer journeys.
Contextual Overlays: Market-level data that explains externally-driven trend components: advertising cost benchmarks, competitive entry timeline, regulatory changes, platform algorithm modifications. This demonstrates awareness of factors beyond your control while implicitly highlighting factors you have influenced.
Segmentation Analysis: Channel-specific and, where relevant, customer segment-specific trend data. This allows buyers to assess where efficiency gains or losses are concentrated and project future dynamics based on your channel strategy. For B2B businesses with $5M-$20M revenue, tracking at least three to five primary channels independently typically provides meaningful insight.
LTV Correlation: Explicit presentation of LTV trend data alongside CAC trends, with ratio analysis showing the relationship over time. This preempts the sustainability question and demonstrates understanding of unit economics at a sophisticated level. Include cohort-based LTV analysis where possible, showing how customers acquired in different periods perform over time.
Forward Projections: Trend-based projections for CAC over the 12-24 month period following acquisition, with explicit assumptions about market conditions, investment levels, and operational changes. Frame these as scenarios with ranges rather than point predictions. These projections invite discussion rather than leaving buyers to develop their own assumptions.
Clear Presentation Rather Than Narrative Control
While trend presentation can provide valuable context, sophisticated buyers will typically conduct independent analysis regardless of how you present your data. The goal isn’t to “control” buyer interpretation, that’s not realistic with experienced acquirers, but rather to present clear, honest data that demonstrates your understanding of your own business.
Sellers who present only snapshot metrics find themselves answering trend-related questions developed from the buyer’s analysis, often conducted with incomplete context about your market, your competitive position, and your operational initiatives. Providing trend context upfront allows for more productive conversations.
Over-presentation of data can signal defensiveness, and complex presentations may obscure rather than clarify. Focus on transparency and clarity rather than attempting to manage perceptions.
Realistic Implementation Costs and Timeline
For owners two or more years from exit, the priority is ensuring you’re capturing the data necessary for eventual trend analysis. This requires deliberate investment in systems and processes, but the investment varies significantly based on your current analytical maturity and business size.
Realistic Cost Ranges:
| Cost Category | Minimum (Basic Tracking) | Moderate (Multi-Channel) | Complete (Full Attribution) |
|---|---|---|---|
| Analytics platform subscriptions (annual) | $0-$2,400 (spreadsheets/basic tools) | $3,600-$12,000 (HubSpot, basic Salesforce) | $12,000-$36,000 (enterprise platforms) |
| Initial system configuration | $2,000-$5,000 | $8,000-$25,000 | $25,000-$75,000 |
| Data cleanup and integration | $1,500-$4,000 | $5,000-$15,000 | $15,000-$40,000 |
| Personnel time (setup) | 80-120 hours | 150-300 hours | 300-500+ hours |
| Ongoing monthly maintenance | 6-10 hours | 12-20 hours | 25-40 hours |
| Training and adoption | $1,000-$3,000 | $3,000-$8,000 | $8,000-$20,000 |
| Total First-Year Investment | $8,000-$20,000 | $25,000-$70,000 | $75,000-$180,000 |
Realistic Timeline:
- Best case: 8-12 weeks for initial implementation if existing systems have good data quality and team has analytics experience
- Typical case: 16-24 weeks including data cleanup, system configuration, process training, and initial reporting optimization
- Challenging case: 6-12 months if attribution modeling requires significant CRM or marketing automation changes, or if historical data requires substantial reconstruction
Key timeline dependencies often underestimated:
- Data quality in existing systems often requires 40-80 hours of cleanup before analysis begins
- Marketing attribution complexity may require platform integrations that add 4-8 weeks
- Team training and adoption of new reporting processes typically requires 3-4 months before reliable insights emerge
- Executive/owner involvement (20-40 hours) for methodology decisions and initial interpretation
When the Investment May Not Make Sense:
For businesses under $5M in annual revenue, detailed CAC tracking may not justify its cost. Simpler approaches (quarterly manual calculations, basic channel tracking, and informal trend observation) may suffice until scale warrants more sophisticated analysis. Buyers of smaller businesses typically prioritize customer concentration, owner dependency, and revenue stability over unit economics sophistication.
ROI Considerations:
The return on CAC tracking investment depends heavily on your exit timeline and target buyer profile. A rough framework:
- Exit in 1-2 years: May not have time to establish meaningful trends; focus on presenting existing data clearly
- Exit in 3-5 years: Moderate investment can establish valuable trend data; 24-36 months of tracking provides meaningful buyer context
- Exit in 5-7 years: Full trend development possible; investment in detailed tracking can support premium valuation narratives
Break-even analysis suggests that CAC tracking investments typically need to influence deal valuation by 0.5-1.0% to justify their cost. For a $10M transaction, that’s $50,000-$100,000 in added value, achievable if trend presentation prevents valuation discounts but not guaranteed.
Common Pitfalls in CAC Trend Analysis
Understanding what can go wrong with CAC tracking helps you avoid common mistakes and set appropriate expectations.
Analysis Paralysis
One of the most common failure modes, particularly for smaller businesses, is over-investment in analytics relative to operational scale. Signs you may be heading toward analysis paralysis:
- Marketing meetings focus more on metrics than on actual customer acquisition activities
- Team members can quote CAC to two decimal places but can’t explain what’s driving it
- System complexity exceeds your team’s ability to maintain and interpret it
- Decisions are delayed waiting for “more data” when existing information is sufficient
Mitigation: Start simple. Basic monthly or quarterly CAC calculations with channel-level breakdowns provide 80% of the insight value at 20% of the complexity. Add sophistication gradually only when simpler analysis leaves important questions unanswered.
False Trend Recognition
Small sample sizes create statistical noise that can be misinterpreted as meaningful trends. A business acquiring 15 new customers monthly might see CAC swing 30% between quarters due to random variation rather than any operational or market factor.
Mitigation: Establish minimum sample size thresholds before drawing conclusions. As a rough guideline, consider:
- 30+ new customers per month: Monthly trend analysis may be meaningful
- 10-30 new customers per month: Quarterly analysis more appropriate
- Under 10 new customers per month: Annual or rolling 12-month analysis only
Consider using statistical confidence intervals rather than point estimates when sample sizes are small.
Short-Term Optimization at Long-Term Cost
Some businesses optimize for impressive CAC numbers through tactics that damage long-term customer value. Examples from our experience:
-
A manufacturing services company showed impressive 18-month CAC improvement by eliminating their trade show presence and cutting their business development team. The immediate efficiency gains disappeared when the sales pipeline exhausted existing relationships, and the business faced a painful rebuild of capabilities they’d dismantled.
-
A technology services firm maintained stable CAC by continuously shifting to lower-quality lead sources, eventually relying heavily on discount-oriented comparison sites. Their customer churn accelerated, LTV collapsed, and a buyer who initially expressed interest at attractive multiples significantly reduced their offer after discovering the deteriorating customer base underlying the attractive acquisition metrics.
Mitigation: Always track CAC and LTV trends together. If CAC improves but LTV deteriorates, or if you’re making capability reductions to achieve CAC improvements, recognize that you may be trading future value for present optics.
Over-Attribution Complexity
Sophisticated multi-touch attribution models can consume enormous resources while providing marginal added insight. Many businesses would benefit more from simple first-touch or last-touch attribution with manual judgment than from complex algorithmic models that require constant maintenance and produce results no one fully trusts.
Mitigation: Match attribution sophistication to your business complexity and analytical capabilities. For most businesses in the $2M-$15M range, simple channel-level tracking with reasonable allocation rules provides sufficient insight for trend analysis.
Actionable Takeaways
For Businesses Under $5M Revenue
Focus on fundamentals rather than sophisticated analytics. Quarterly CAC calculations using simple methodology (total sales and marketing expense divided by new customers) provide baseline awareness. Track customer retention and revenue per customer as informal LTV indicators. Invest in customer acquisition effectiveness before customer acquisition measurement.
For Businesses $5M-$15M Revenue (This Quarter)
Audit your CAC calculation methodology and ensure consistency with historical periods. Document your approach explicitly, including which costs you include, how you handle multi-touch attribution, and your customer definition. Begin or improve channel-specific tracking if your current data only supports aggregate calculations. Budget 60-100 hours of initial team time and $5,000-$15,000 in potential system costs.
For Businesses $5M-$15M Revenue (Next 6-12 Months)
Develop a trend analysis dashboard that you review monthly or quarterly. Plot CAC, LTV, and the LTV/CAC ratio over time. Add contextual markers for significant events: competitive entries, channel changes, pricing modifications, sales team changes. Begin collecting external market data that provides context for your trends.
Establish investigation triggers appropriate to your business. As a starting point, consider investigating when CAC increases more than 15-20% quarter-over-quarter or when the LTV/CAC ratio declines below 3:1 for two consecutive quarters, but adjust these thresholds based on your industry norms and historical volatility.
For Businesses $15M+ Revenue or 12-24 Months Pre-Exit
Prepare a trend-based unit economics presentation using the framework outlined above. Develop explanatory narratives for any concerning periods in your CAC history: buyers will ask, so prepare proactively. Compile supporting market data that enables contextual interpretation of your trends. Consider engaging financial advisors to review your presentation from a buyer’s perspective before you enter the market.
Ongoing Disciplines (All Sizes)
Treat CAC trend monitoring as one vital sign among several, not the only indicator of business health. Build trend awareness into marketing and sales team discussions without creating analysis paralysis. When evaluating marketing initiatives or sales process changes, consider the expected impact on acquisition cost trends, but don’t let measurement complexity delay necessary operational decisions.
Conclusion
The story your customer acquisition costs tell goes beyond today’s numbers. Many sophisticated buyers read trend data as one narrative among several about your market position, competitive resilience, and operational capability, a narrative that can influence their willingness to pay premium multiples.
Point-in-time metrics provide benchmarks, but trend analysis reveals trajectory. A business with higher-than-average CAC on an improving trend may attract more buyer confidence than one with impressive current numbers masking deteriorating fundamentals. The relationship between CAC movement and customer lifetime value evolution adds another dimension, distinguishing genuine efficiency gains from short-term tactics that sacrifice future performance.
For owners of recurring revenue businesses planning exits in the two-to-seven year window, CAC trend optimization represents a high-leverage activity, though not the only one. The appropriate investment in tracking and analysis depends on your business size, complexity, target buyer profile, and exit timeline. The trends you’re creating today become the due diligence data buyers may examine tomorrow.
Before investing heavily in sophisticated analytics, honestly assess whether your business model and scale warrant that investment, whether your team has the capability to implement and maintain complex tracking, and whether the potential valuation impact justifies the cost. For many businesses, simpler approaches provide most of the benefit at a fraction of the complexity.
Your customer acquisition costs are telling a story right now. The question is whether you understand what that story is, and whether it supports the exit outcome you’re working toward.